
Using the Market to Evaluate Recruits
Predicting recruiting prospect star ratings based on who is recruiting them and who they're visiting.

All results from the described model can be found on a Shiny app HERE.
Consider three QB recruits. QB A is 6’3 & 190lbs, has 36 Power 4 offers, and has only visited top tier SEC schools the summer before his senior year. QB B is 5’11 3/4” & 193 lbs, has 21 P4 offers, and only visited one low level Power 4 school the summer before his senior year. QB C is 6’1 & 165 lbs, has 5 P4 offers, and visited one Power 4 school early in the fall of his sophomore season. If you were to rank the QBs, you would probably rank them A, B, then C. Despite not knowing anything about how strong their arms are, how accurate they are, or how athletic they are, you were able to rank Dia Bell, Sawyer Anderson, and Michael Johnson the same order as the recruiting services.
Since better programs tend to recruit better prospects, it is possible to predict how highly rated a recruit will be given who is recruiting them. This process can be more rigorous and repeatable by creating a model with these same size, offer, and visit inputs. By taking this approach, we are able to predict star ratings within roughly 0.45 stars for every position, and we find evidence which suggests that highly recruited but lowly ranked players may be more likely to transfer down as freshmen.
The model is a series of multinomial logistic regressions, split by position, which takes in each recruit’s size, offers, and visits and predicts their chance of being a 3 Star, 4 Star, or 5 Star recruit.They all consider a recruit’s height, weight, BMI, number of offers, and the program which had the highest team rating in the last cycle. There’s slight positional variation in which features they use to quantify visits, but they all use at least one of the following features: number of official visits the recruit has been on, the range in quality of the official visits (as measured by each program’s rating in the last cycle), and/or an average visit quality weighted by time until national signing day.

With the probability of each potential star rating we construct an expected star rating. This star rating is then rounded into quarter star buckets. Quarter star buckets are the smallest granularity the model can meaningfully capture. Before rounding though we ought to perform a simple sanity check. Star ratings are mostly direct functions of lower level 1-100 ratings, so our star ratings ought to correlate very well with industry ratings.
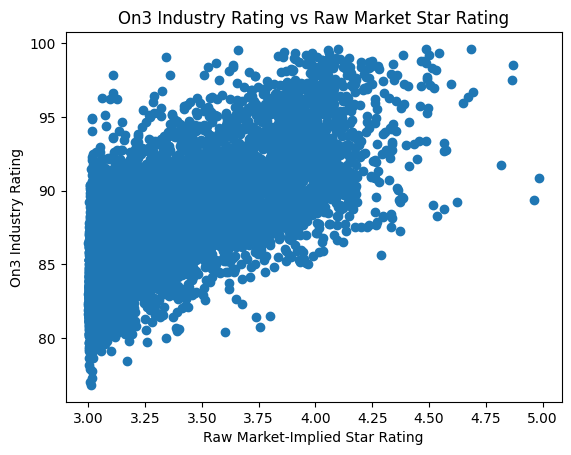
The R-2 of 0.53 in the observed data is tremendous as far as sports analytics tends to go. It’s entirely expected given we are modeling essentially a function of the industry rating, but it’s evidence that we are doing a reasonable job of modeling the problem. There are some temperature scaling problems where very few players are predicted to be a 4.5 star or higher. Partially this is a classic class imbalance issue since there are relatively few 5 stars, and also the difference between a 4 star and 5 star is largely information the model is not privy to. But the major factor is that the status of 5 star is only assigned to the top 32 players in a given class. In other words, a 4 star RB in 2023 can be as talented as a 5 star RB in 2022, but 2023 happened to have more phenomenal DL so the player is left as a 4 star. Since the model cannot easily figure that out, it mostly does not assign high 5 star probabilities.
We have evidence that we are not completely missing our target variable. Terrific. But we want to know that the model is also meaningfully capturing distinctions between recruits. To prove that the model is meaningfully capturing distinctions between recruits, we can look at transfer down (Power 4 → Non-Power 4) rates between those who are overrated by the market and those who are underrated by the market.
The rapid changes to the recruiting landscape with NIL deals, the transfer portal, and the soon-to-be-implemented House settlement were taken into account with the first 3 post-NIL classes (2021-23) were used as training data. Although this limits the testing set to one class which has played college football, 2024, we are still able to observe how often players couldn’t cut it and transferred down after their freshman season. To control for some externalities - namely that higher rated players transfer down at lower rates than lower rated players - we will keep our focus on players who were rated by the industry as 3 stars coming out of high school. Given the small sample it will be impossible to draw strong conclusions, but we can hopefully see some directional results.

3 star recruits which have a higher market rating than industry rating broadly transferred down at higher rates than their lower/properly rated counterparts. In other words, a freshman 3 star running back who was recruited similarly to a 4 star RB was slightly more likely to transfer down than a freshman 3 star RB who was recruited like a typical 3 star. Why is this the case? My personal theory is that the players in the overrated group are more likely to have some flaw, such as being too slow, which prevented them from getting a higher scouting grade in the first place. That flaw which reduced their scouting grade then makes them easy targets to transfer down. The underrated/properly rated group may be equally skilled, but without a glaring flaw they can stick around longer.
Given the sample sizes involved this evidence is at best directional, but it helps give us some indication that the model is picking up something interesting beyond what the scouting alone provides. This makes it an interesting and potentially valuable data point to keep in mind as we continue to analyze recruiting.
If you enjoyed this post, please subscribe so that you can receive emails updating you upon every post and share this with others who you think might enjoy. This is a free newsletter, but if you are feeling so generous you can buy me a coffee.